
DeepSeek R1 — H100 vs MI300X Performance per Dollar
Cost per million tokens of H100 (NVIDIA Hopper) versus MI300X (AMD CDNA 3) on DeepSeek R1. Owning-hyperscaler TCO normalized by output tokens — performance per dollar across LLM workloads. Pick the more cost-efficient SKU at every target interactivity level. Use the chart controls below to switch sequences, precisions, and metrics — same interactions as the main inference chart.
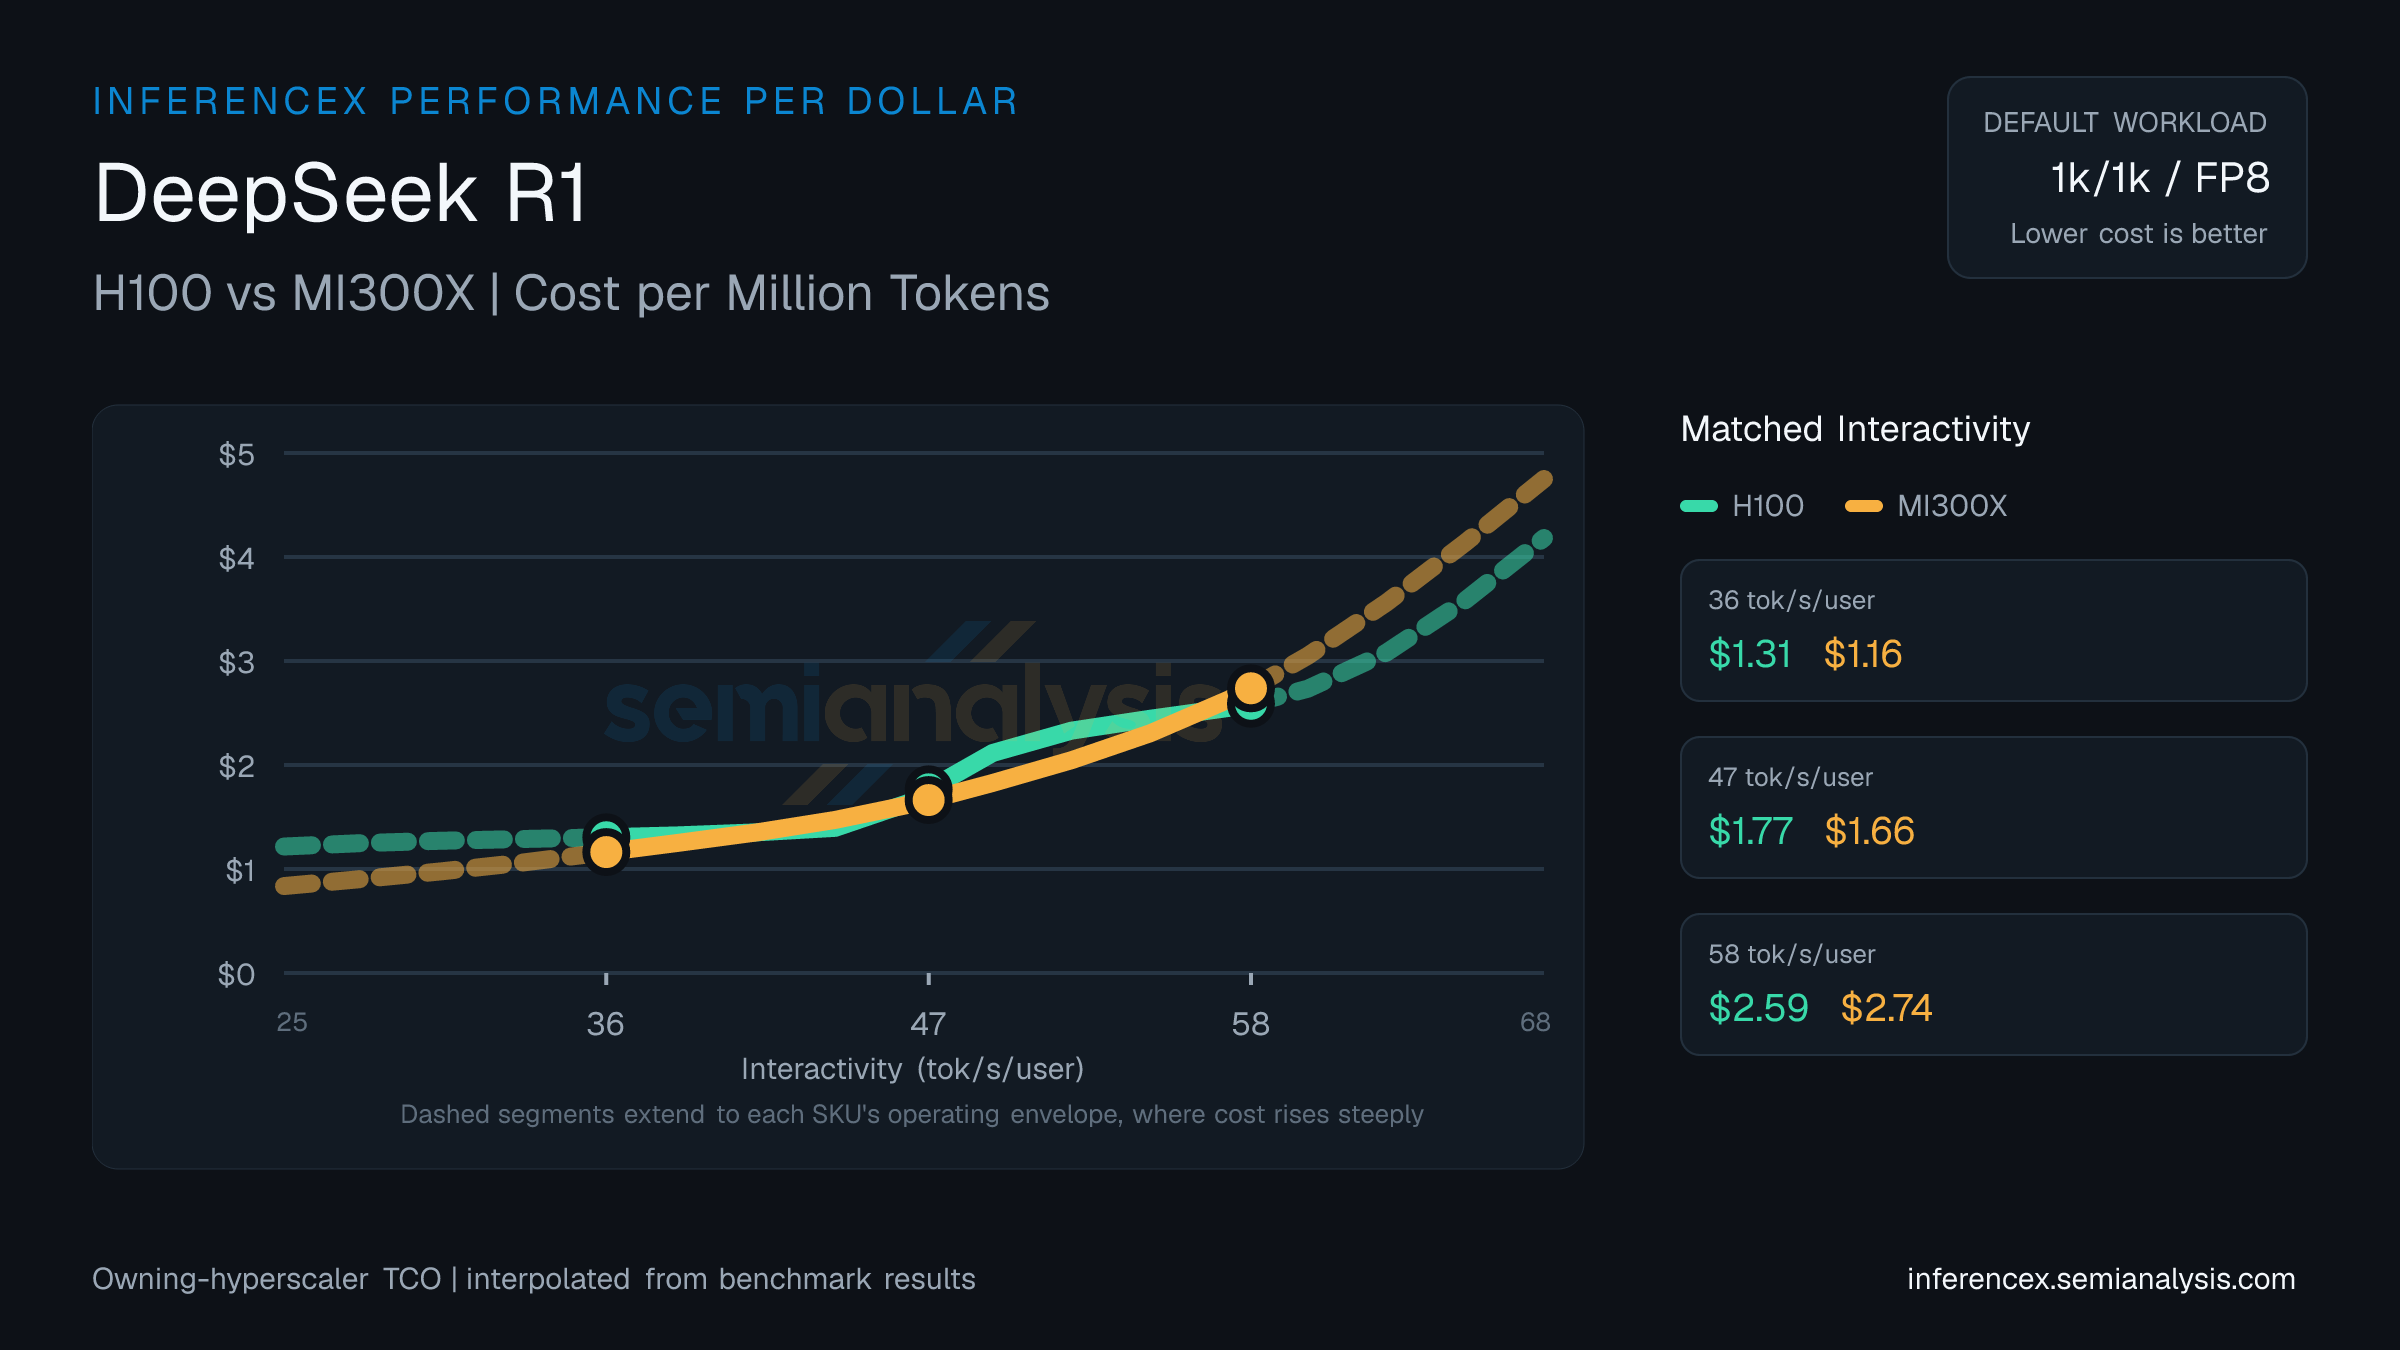
MI300X edges H100 at 36 tok/s/user on DeepSeek R1 — $0.99 per million tokens versus $1.17, a 19% cost-per-token gap.
Push DeepSeek R1 to 47 tok/s/user and H100 lands at $1.59 per million tokens against MI300X's $1.41 — MI300X pulls ahead by 13%.
At 58 tok/s/user on DeepSeek R1, H100 and MI300X land within ~1% on cost per million tokens ($2.33 vs $2.32) — call it a tie at this operating point. (Numbers reflect the default 1k/1k · fp8 selection for this URL — table and chart below update if you change sequence, precision, or model in the controls.)
Chip pricing (owning hyperscaler): H100 $1.17/chip/hr · MI300X $0.95/chip/hr. Source: SemiAnalysis Market July 2026 Pricing Surveys & AI Cloud TCO Model.
| Metric | Interactivity (tok/s/user) | Interactivity (tok/s/user) | Interactivity (tok/s/user) |
|---|---|---|---|
| Dollar per Million Tokens | H100:$1.175MI300X:$0.986 | H100:$1.589MI300X:$1.410 | H100:$2.330MI300X:$2.322 |
| Concurrency | H100:~666MI300X:~31 | H100:~293MI300X:~17 | H100:~140MI300X:~8 |
Inference Performance
Inference performance metrics across different models, hardware configurations, and serving parameters.